Google Analytics is a free data tracking tool available as part of the Google marketing platform and shows you how visitors use your website. For example, let’s say you have an e-commerce site and you want to know how many users visit your website.
With the help of Google Analytics code, you can see the number of visitors on your site, from which traffic source they come from, which devices they use, and much more.
Using Google Analytics may seem difficult at first, but it’s actually not that hard. I’m here to help you with Google Analytics.
What Does Google Analytics Do?
There are many benefits to using Google Analytics, you can learn the user behavior on your site with the Google Analytics code.
Some of these user behaviors are:
- Measuring website performance.
- See if marketing activities are working.
- Understanding what type of content to create or sell on your website.
- Sorting users into different categories (age, gender, country, device, etc.)
- Optimizing website pages to increase conversions.
What is Google Analytics Property Tracking ID?
The Google Analytics property tracking ID is a code structure called a tracking ID and a property number, made up of a programming language called JavaScript, that tracks your website visitors and any action they take. You don’t need much to understand the content of the code, but you have the right to know how it works.
Let me tell you like this; When a user visits a website, Google Analytics will place a cookie on the user’s browser. You probably know what cookies are, if you don’t, cookies are files that contain information about the user’s activities.
When you visit the website recently, you may have seen the text “I have read and accept cookies” below. That’s what Google calls “cookies” 🙂
By using these cookies, Google Analytics learns how a user behaves on your website and collects this information for later transmission to the site owner.
How to Create a Google Analytics Account?
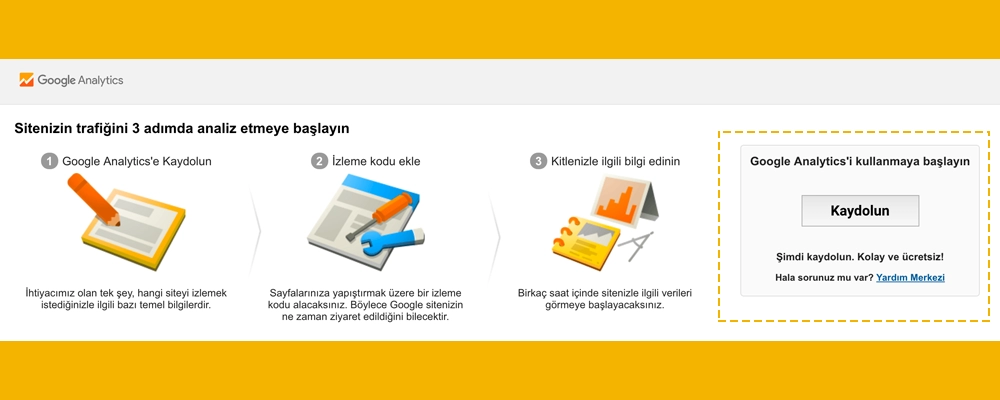
Go to the Google Analytics homepage and click the Sign Up button.
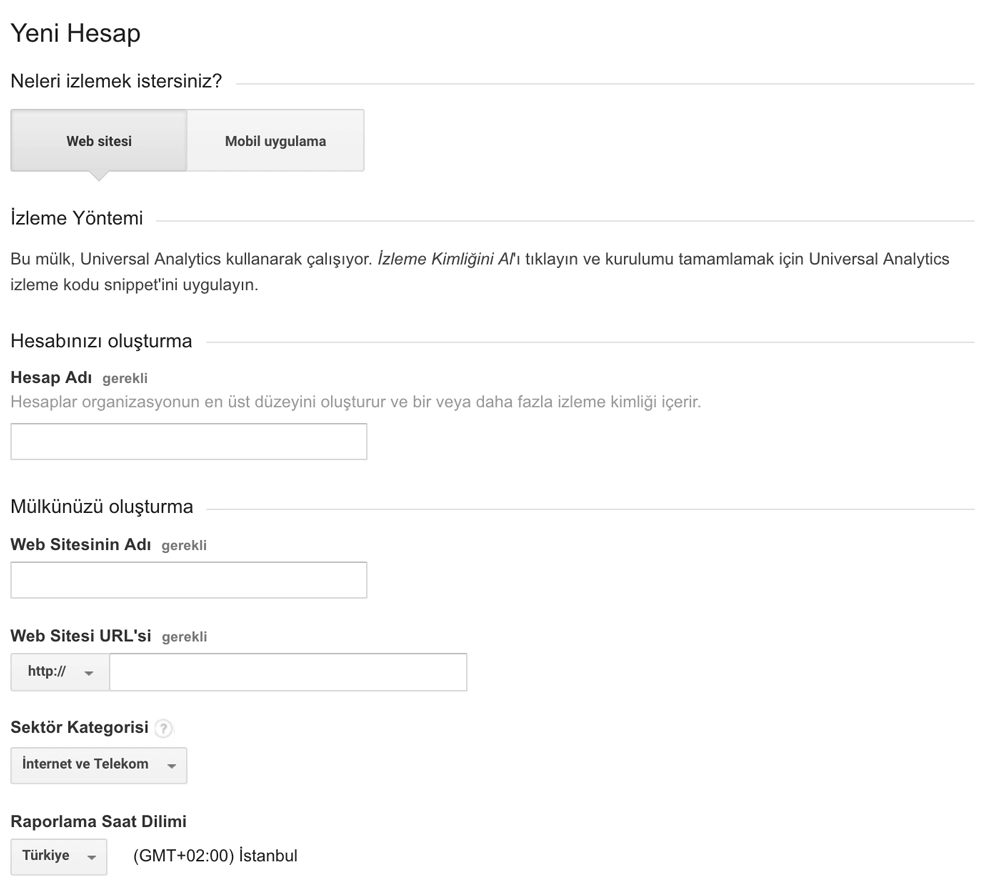
Enter your account name and website domain name, you can use your own name or business name. Then, fill in any other requested information.
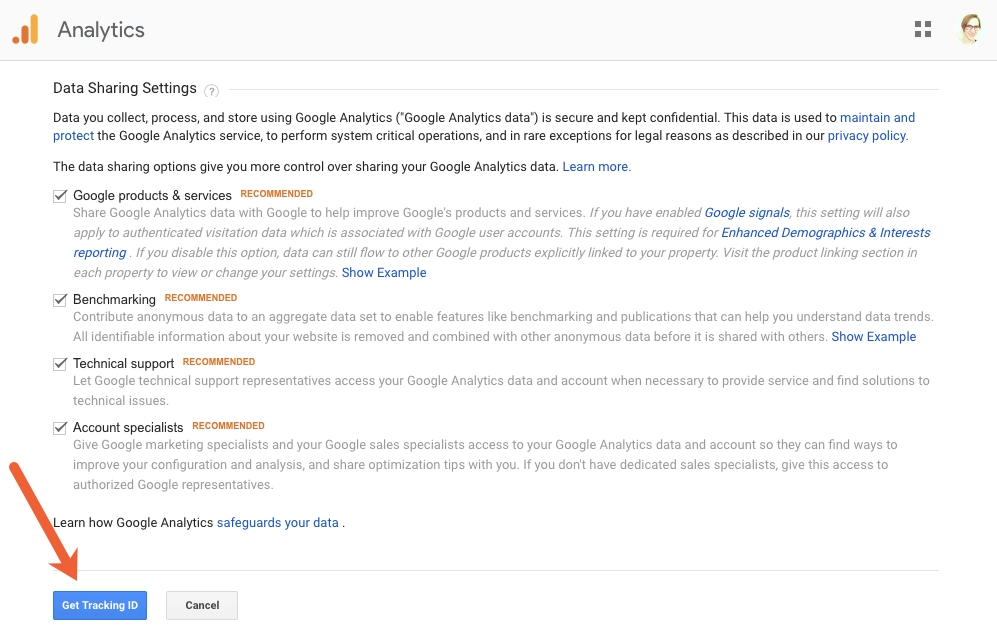
Read the data sharing options and uncheck the ones that are not suitable for you. Then click on Get Tracking ID .
Read the terms of data sharing and service agreements, check the boxes to accept the terms and click I Agree .
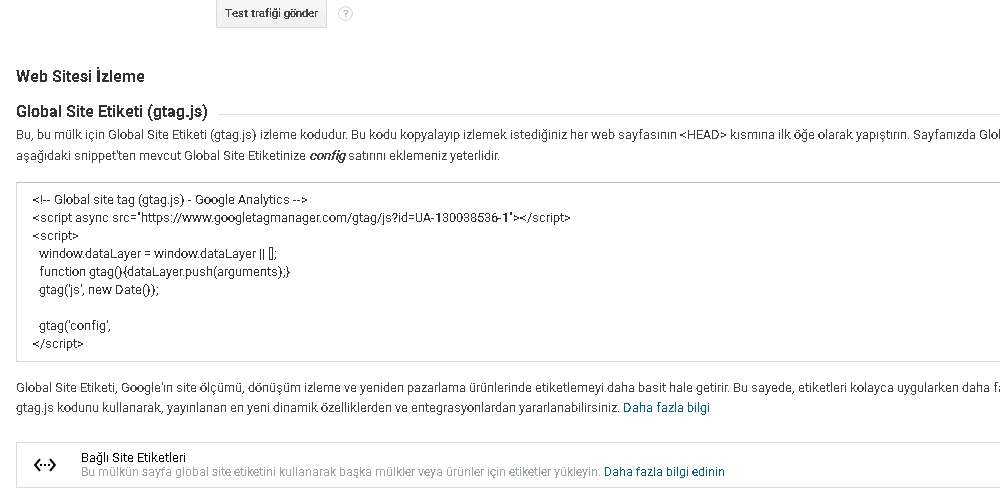
After you do this, Google Analytics will generate a code for you to add the tracking ID to your website.
📜Google Analytics is also very important for tracking your ad performance, you should follow the conversions brought by Facebook ads or Google ads , and constantly optimize your ads according to the data you get from here.
How to Add Google Analytics to WordPress
You can use a plugin to automatically add the Google Analytics tracking ID to every page of your WordPress site. We will now use a plugin called Google Analytics Dashboard For WP, which is a free plugin for WordPress.
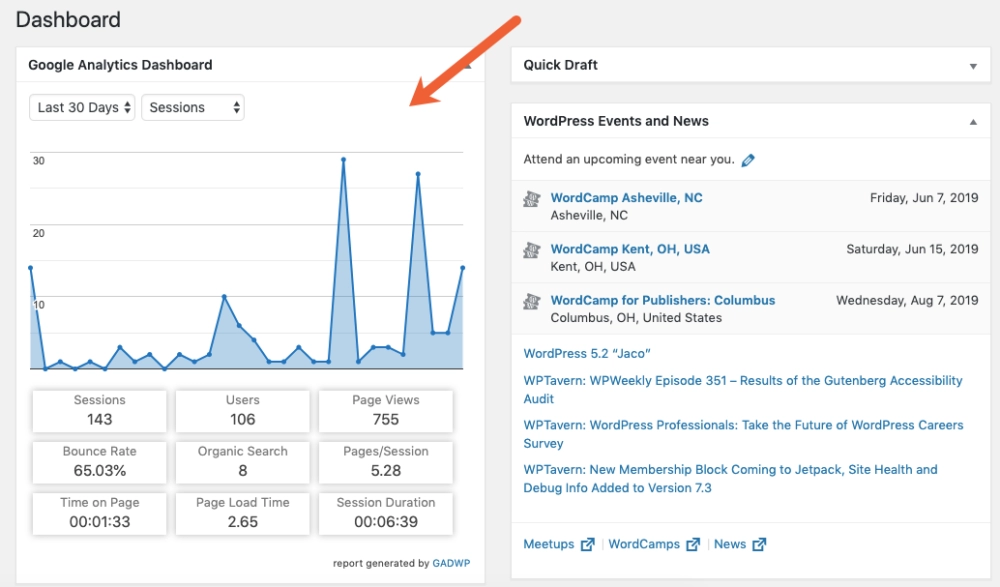
This plugin makes it easy for you to add the tracking ID and adds a Google Analytics dashboard to the WordPress dashboard so you can see your site’s statistics from WordPress.
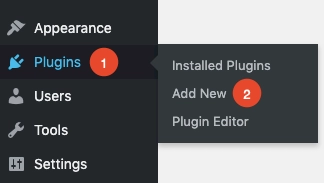
To install the Google Analytics Dashboard on your site, log into your site’s WordPress and log in. Click on Plugins and Add New .
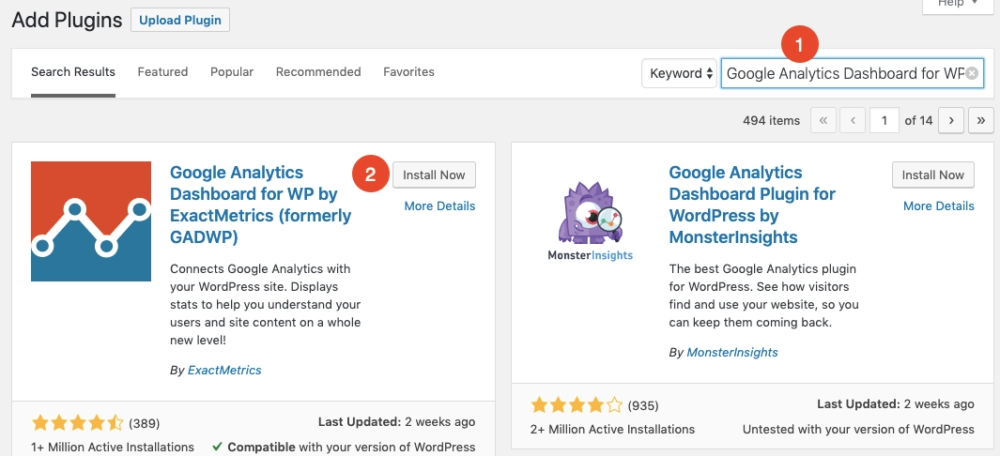
Type Google Analytics Dashboard for WP in the search bar, then find the plugin and click install now .
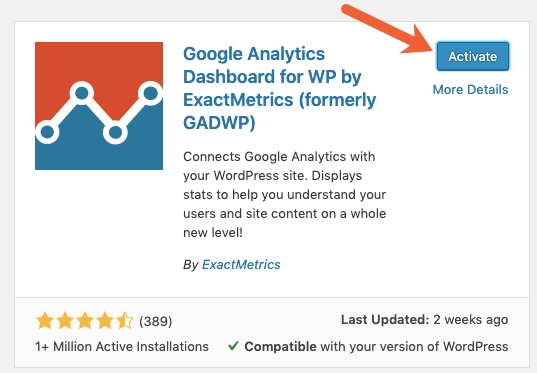
Once the plugin has finished installing, click Activate , it will take you to your installed plugin list.
Now find the Google Analytics Dashboard WP for plugin in your plugins list and then click on Settings under it.

On the settings page , click on Authorize plugin .
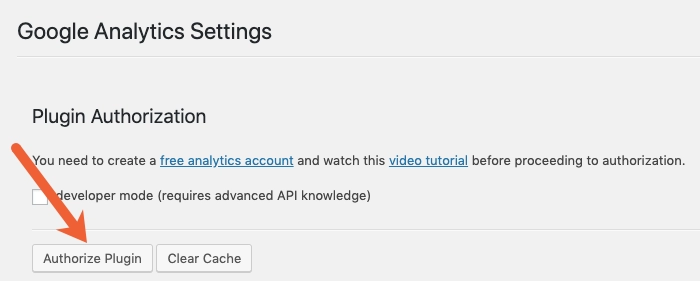
Click Get Access Code .

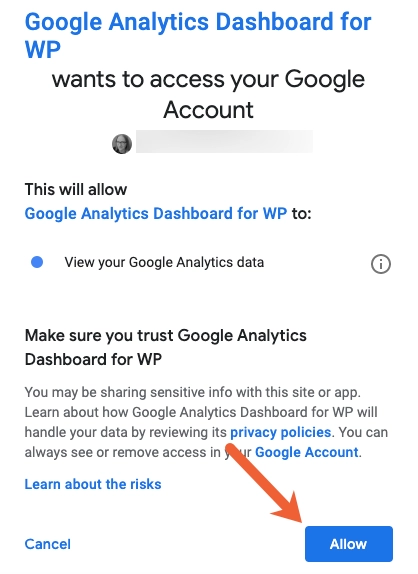
Sign in to the Google account you used to sign up for Google Analytics and click the Allow button to grant add-on access to Google Analytics data .
Copy the tracking ID code provided.
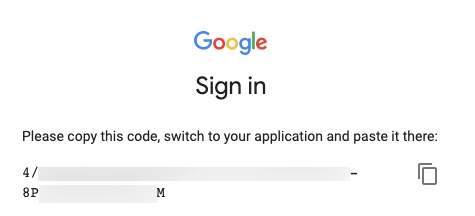
Go back to WordPress, paste the tracking ID code in the Access Code box and click Save Access Code .

That is all. 🙂
This plugin automatically adds the Google Analytics tracking code to all pages on your site and displays Google Analytics data in your WordPress dashboard.
How to Use Google Analytics
If you’ve created an account, created a tracking ID code, and added it to your WordPress site, it’s time to see how to use Google Analytics. The Google Analytics home page has general information about how the website is performing.
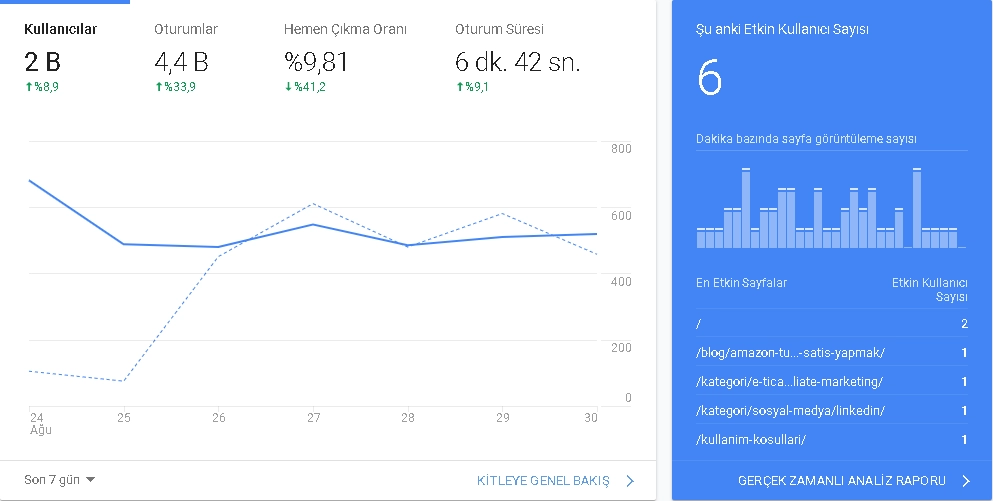
For example, you might see:
- Users: Shows how many visitors come to your site.
- Sessions: Shows visitors’ interactions on your website, such as viewing a page, clicking a page.
- Bounce Rate: The rate that calculates how many visitors hit the back button without doing anything or closed your website.
- Session Duration: Shows the average time a visitor spends on your website.
- Current Active Users: Shows how many active users are active on your website
⭐The lower the bounce rate, the lower the bounce rate on your website, which indicates success.
On the left side of the Google Analytics homepage, you will see a panel like the one in the corner image. This panel has five report options: Real-time, audience, acquisition, behavior, conversions.
With these different report options, you can find data showing how the user interacts and behaves on your website.
Let’s take a closer look at what these reports do, what kind of data they provide, and how you can use this data effectively for your business.
Real Time Report
The real-time report is the section where you can see the number of users on your website and the user activities on your website instantly. In the Overview section, you can see how many visitors you have instantly, the country or city they are in, and the most active pages of the website.
You can also see the source, social media channels, keywords that drive the most traffic to your website.
The overview report will show all the important information, but if you want to know more about the real-time performance of the website, you can use the options under the overview such as traffic sources, content, events, conversions and places.
Audience Report
The audience report in Google Analytics helps to find out which country or city your website visitors are from, what language they speak, or whether the device they use to view your website is mobile or desktop. There are many report options under the audience report in Google Analytics and you can use the data in these reports according to your needs.
For example, you can use the demographic report to find out what age and gender group your visitors are most in. If you choose the Geographical report, you can see which countries your site is getting the most traffic from and what language they speak. This way, you can customize your products or services, create content, and customize landing pages for visitors from different regions.
Another important report you can use is which device your mobile visitors are using to view your website under the audience section. For example, if you’re getting more visitors from desktop than mobile, chances are you haven’t optimized your website for mobile.
Acquisition Report
The acquisition report shows where traffic is coming from to your website in five categories:
- Organic Search: Shows organic traffic from search engines like Google or Bing.
- Direct: This is traffic when someone types the URL of the website, opens the website with a bookmark, or comes from a source Google doesn’t recognize.
- Recommendation: Traffic from any source other than search engines, such as a link from another website or a YouTube video.
- Social media: This is traffic from social media platforms like Facebook or Twitter.
- Ads: This report shows the traffic you drive with ads.
If you want this more detail, you can search through the acquisition report section to know all the traffic sources. For example, if you want to know which search engine is bringing in the most organic traffic, select Acquisition >> All Traffic >> Source.
It will show exactly how many visitors came from which search engine. Similarly, you can use Referrals to find out which site is giving you heavy traffic.
Using this information, you will learn where to invest your time and money. For example, if you have little organic traffic, you need to focus more on your search engine optimization efforts. You can integrate your Search Console and Google Ads account with Google Analytics, both reports will appear in the Acquisition section.
Behavior Report
To find out what your visitors are doing on your website, you can refer to the Behavior report in Google Analytics.
In the overview section, the parameters that show you the behavior of visitors instantly are:
- Pageviews: The total number of pages viewed by your visitors.
- Different pageviews: The page that each user has seen on your website at least once.
- Average time on page : The average time a visitor spends viewing a page on your website.
- Bounce Rate: Percentage of visitors who view only one page and bounce.
- Exit Percentage: Shows how often visitors leave a page or part of the website.
Along with these metrics, you can also see the top performing pages of the website. You can also learn about user behavior by looking at the Behavior Flow report for more details, which gives a complete picture of your visitors. You can then view the Site Content report to see how different content types or pages are performing, there is much more data in this section.
Let’s say you want to see how your visitors behave on the most trafficked pages, then you should view the All Pages report. You can also see which landing pages are performing better than others using the Landing Pages report.
It shows how much traffic a landing page gets, how much time the visitor spends on the page, and what the landing page’s conversion rate is, and using the exit pages report, you can also view the page from which visitors exit the most.
As a newbie to Google Analytics, another important report you might want to check out is the Events report, which is used to track page button clicks, external links, videos, and other user interactions. Let’s say you have five products on your website.
To see which product is best sold;
You can find out by going to Behaviors>> Events>> Overview, this way you can add products similar to your bestsellers, create them or optimize your other products to get more clicks or downloads.
Conversion Report
Finally, we come to the last report in Google Analytics, the Conversion report, which, as the name suggests, shows how the website’s conversion rate is performing. If you run an e-commerce site, the E-Commerce section is very important to you.
It shows individual product performance, sales performance, order size and purchase time. All these metrics can help you improve your online store and increase conversions.
In this article, I told you what you need to know about Google Analytics. If you have a problem, you can ask me a question in the comment section or you can read more articles in Google’s Analytics Help section.
You can become a member of our site to grow your Instagram accounts and increase your followers, likes, views and subscribers. Click to see our social media products.

What is Google Family Link? – Blog | Views On
4 April 2022 at 22:00[…] The last opportunity you will get with the Family link application that you will start using will be to lock the device. […]